It could be a struggle: you have collected hours of rich video content, but turning those individual clips into a cohesive, strategic narrative is a heavy lift.
Yet, the need for visual storytelling has never been higher. Studies show that visualising data makes insights 60% more memorable and speeds up understanding by up to 40%. At a time where showing impact has become as important as ever, this isn’t just a “nice to have” – it is a game changer for anyone turning participant stories and experiences into strategy and business decisions.
That is why our AI-powered journeys are such a valuable and impactful tool.
Why “Sentiment Scoring” Instead of Self-Reporting
Traditionally, mapping a journey required asking participants to rate their experience at every touchpoint (e.g., “Rate your frustration on a scale of 1-5”). The problem? Humans are unreliable narrators of their own emotions. We rationalise, we forget, or we rush through surveys.
We decided to take a different approach. Rather than asking participants to rate each touchpoint – to avoid the trap of self-reporting – our tool uses AI sentiment analysis to detect how they talk about it.
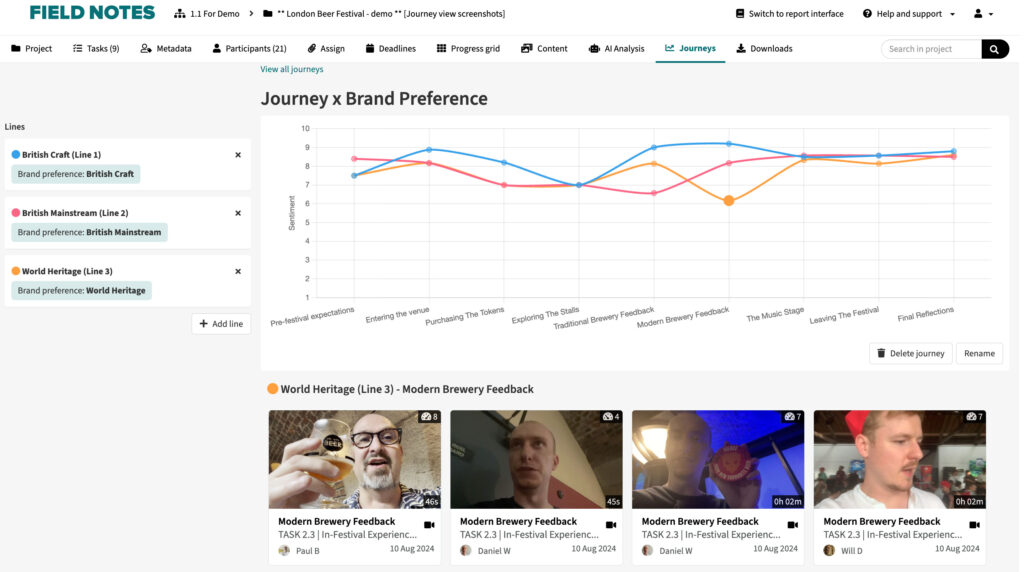
By analysing what the participants say, the platform automatically creates and displays their emotional journey. This lets you spot the highs and lows instantly, based on how the participant actually felt in the moment, not how they rated it in a survey form.
Compare, Contrast, and Conquer
One of the most powerful features of this update is the ability to compare journeys across segments and typologies.
You aren’t just looking at one flat line. You can overlay the journey of “Loyalists” against “Switchers,” or “Gen Z” against “Boomers.” The visualisation allows you to see how and where these groups overlap and – crucially – where they take different turns.
Does one group experience a “high” at the same moment another experiences a “low”? The comparison view makes these nuances obvious at a glance.
Save Time, Sharpen Storytelling
Manual analysis of large volumes of video data used to take days. With this new feature, you can save hours on analysis.
The AI automates the “plotting”, freeing you up to focus on digging into the “why” and crafting sharper strategic recommendations. You get the full story – emotional peaks, behavioural shifts, and friction points – presented in a way your clients, stakeholders and colleagues will actually remember.
Find out more about our approach to AI and AI capabilities here